
User guide


64 Chapter 6: Analyzing Spectrum Data
AirMagnet Spectrum XT User Guide
Technically the power range in the Real Time FFT graph can be set as low as -140 dBm
(Minimum Power) and/or as high as 0 dBm (Peak Power). When a narrower power range is
used, e.g., -120 dBm ~ -30 dBm, the user may notice some discrepancy between what is shown
in the Real Time FFT graph and what is displayed in the tool tip when the actual power
readings fall beyond either or both the Minimum Power and/or Peak Power limit. For
instance, if the power range is set between -120 dBm and -20 dBm, you will not be able to see
any power reading lower than -120 in the graph because it falls beyond the Minimum Power.
However, you will be able to see the actual power readings in the tool tip even when they fall
outside the specified power range because the tool tip is not affected by the power range set
for the Real Time FFT graph.
Note that the power readings shown in the tool tip are not updated in real time and may not match
what is shown in the Real Time FFT graph.
Channel Duty Cycle Overlay on FFT Graph
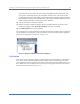
The FFT Graph may be configured to show an overlay of Channel Duty Cycle data. This
setting option is added to the FFT Chart Configuration settings as “Show Duty Cycle.”
With this option enabled, the duty cycle data will overlay the FFT graph as semi-transparent
bars. Both WiFi and non-WiFi data are displayed as indicated by the legend in the upper right
of the graph. The Duty Cycle percentage is shown on the far right Y-axis.
Figure 6-4: FFT Graph Showing Channel Duty Cycle
Setting FFT Graph Parameters
In the upper-right corner of the Real Time FFT graph comes with a Configuration button
which allows you to set or change a number of parameters in the Real Time FFT graph.