
User guide


AirMagnet Spectrum XT User Guide
Chapter 6: Analyzing Spectrum Data 63
As seen from Table 6-1, the Real Time FFT graph may display four types of spectrum data that
are color-coded. The number of data types displayed depends on the configuration settings.
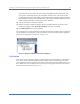
You can see a brief text description of the spectrum data such as the Maximum, Average, and
Current power readings as well as the radio frequency using the tool tip which, if enabled,
will pop up where you place the causer in graph. See Figure 6-3.
Figure 6-3: Using tool tip
The tool tip shows the following information about the point of interest in the Real-Time FFT
graph:
•(RF) Frequency
• Max-hold (power reading)
• Maximum (power reading)
• Average (power reading)
• Current (power reading - if enabled)
Table 6-1: Real Time FFT Graph Parameters
Color Spectrum Data Description
Yellow Max-hold The highest power readings that have been recorded since the
session began.
Red Max The maximum power in the RF Spectrum of a single channel
sweep. Each FFT consists of 256 samples in 6.4 microseconds. A
100ms dwell on a channel results in 15,625 FFTs.
Green Average The average historical power readings recorded since the
beginning of the session.
Blue Current The last sampling power in the RF Spectrum of a single channel
sweep.
Note: The Current option is disabled by default; it can be enabled by
modifying the Graph Options.