
User guide


62 Chapter 6: Analyzing Spectrum Data
AirMagnet Spectrum XT User Guide
• Channel Duty Cycle vs Time
• Interference Power vs Time
All these graphs are listed in the Spectrum Graphs list menu, which is available in all
individual graphs.
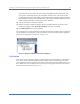
To access the Spectrum Graphs list menu:
1) From graph window, click the title of a graph.
2) From the drop-down menu, select Spectrum Graphs. See Figure 6-1.
Figure 6-1: Spectrum Graph options
Real Time FFT
The Real-Time FFT (Fast Fourier Transform) graph displays in real time the value of RF power
as a function of radio frequency. The X-axis shows the frequency range of each channel in the
selected radio band; the Y-axis shows power readings in dBm. See Figure 6-2.
Figure 6-2: Real Time FFT graph