
User guide


AirMagnet Spectrum XT User Guide
Chapter 7: Analyzing WiFi Data 103
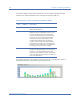
Channel Signal/Noise Ratio
The Channel Signal/Noise Ratio graph shows the ratio of signal to noise present on each
displayed channel. The X-axis shows the list of selected channels while the Y-axis displays the
ratio in terms of dB. See Figure 7-17.
Figure 7-17: Channel SNR Graph
Channels by Retry/CRC
The Channels by Retry/CRC graph shows the percentage of traffic present on each channel
composed of Retry and Cyclic Redundancy Check (CRC) packets. The X-axis shows the list of
selected channels while the Y-axis displays the percentage level. As shown in the color legend,
Retry traffic is displayed in green while red represents CRC transmissions. See Figure 7-18.
Figure 7-18: Channels by Retry/CRC