
User guide


AirMagnet Spectrum XT User Guide
Chapter 7: Analyzing WiFi Data 101
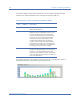
If you place the cursor over a bar, a tip screen will pop up showing the breakdown of the
volume of transmission by transmission rate by that AP. See Figure 7-14.
Figure 7-14: Viewing AP transmission breakdown by data rate
The tip screen also shows some basic information about the AP, such as its name or IP
address, the channel it is using, its SSID, and its MAC address.
Top 10 Active APs' Retry/CRC
The Top 10 Active APs’ Retry/CRC graph shows the percentage of packets that are either
Retry or CRC packets for the top 10 APs that are transmitting the most data. The X-axis
display APs that have been detected and the types of packets being transmitted (Retry vs.
CRC); the Y-axis shows the percentages of Retry and/or CRC packets. See Figure 7-15.
Table 7-8: Color Scheme for Top 10 APs by Speed Graph
Color Transmission Rate (in Kilobytes)
Blue .11nM (for all 802.11n transmissions)
Orange 36~54
Green 12~24
Yellow 11
Aqua 2~9
Red 1