
User guide


AirMagnet Spectrum XT User Guide
Chapter 7: Analyzing WiFi Data 97
If you place the cursor over a channel, a tip screen will pop up showing the volume of data
transmitted using each type of media. See Figure 7-8.
Figure 7-8: Tip screen showing transmission by media
Channels by Address
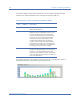
The Channels by Address graph shows the volume of data transmission in kilobytes that has
been recorded on each channel in the selected radio band. It also provides a rough breakdown
of the transmission by the type of address (.i.e., broadcast, multicast, and unicast) that was
used for the transmission. The X-axis shows the available channels and the type of address on
each channel; the Y-axis shows the volume of data in kilobytes being transmitted. See Figure
7-9.
Figure 7-9: Channels by Address graph
Table 7-5: Color Scheme for 802.11 Media Types
Color Media Type
Blue 802.11n
Orange 802.11g
Green 802.11b
Aqua 802.11a