
User guide


92 Chapter 7: Analyzing WiFi Data
AirMagnet Spectrum XT User Guide
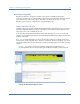
Since the WiFi Devices graph contains a great deal of data that require a lot of screen space,
you may need to custom AirMagnet Spectrum XT’s user interface in a way to make it easy for
you to view WiFi device data. You can custom your screen space by doing either or both of the
following, depending on your screen resolution:
• Hide the entire Spectrum-WiFi Summary section by clicking (AutoHide).
• From the toolbar, click Settings and then uncheck (hide) all the graphs except for
the one that corresponds to the WiFi Devices graph.
The order in which data are presented in WiFi Devices graph can be changed as well. All you need
to do is to drag and drop, one at a time, the title of a column to where you want it to be.
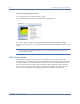
AP Signal Strength Graph
The AP Signal Strength graph displays up to three APs with the strongest signal strength
readings on each channel in the selected radio band. The X-axis shows all available channels
in the radio band, and the Y-axis shows AP signal strength readings in dBm. See Figure 7-3.
Figure 7-3: AP Signal Strength graph
As shown in Figure 7-3, the three highest AP signal strength readings are color-coded. Table
7-2 describes the color schemes used in the AP Signal Strength graph.
Last Frame
Time
Last Frame Time - The time the last frame involving a
device was detected.
AP Name The name of the AP itself or of the AP that provides
service to a station or phone.
Table 7-1: WiFi Device Data
Data Description