
Manual

Mother Board Diagnostic Display
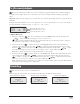
The TDC-100/200 features a 2-line, 16 character LCD display for quickly viewing for system diagnostic informa-
tion. Use the left button bellow the LCD to scroll through the display lines and if needed, use the right button to
scroll through the available options.
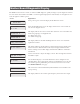
Screen Explanation
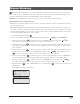
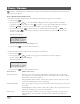
Rev 2.02
03/28/2011
After power up, the screen will display board’s rmware version.
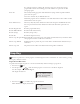
D1 A=1.500
D2 = OFF
After the initial Revision screen, the display will show the total real time cur-
rent for each daughter board.
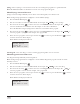
D1L1=0.123 A
D1L2=0.121 A
D2L1=0.224 A
D2L2=0.223 A
e display will also show the total real-time current for each of the white and
black wire groupings of a daughterboard.
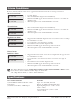
L1 = Black wire group
L2 = White wire group
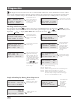
Rain sw =open
Pump pres=closed
e display will show the Rain and Pump Pressure sensor state and will be
updated in real time.
D1 DEC 32396
10 min Send...
e display will show the information contained in the message during trans-
mission execution. e information will only be displayed while the trans-
mission is being executed. e display will refresh if a dierent command is
transmitted.
Display Contrast
Psh Opt to Adj
Scroll to this menu to adjust the display contrast. Press the right button below
the LCD to adjust.
No Alarms
Use the Alarms display to view fault information such as daughter board
thermal alarms, shorts, high current and wire load imbalances. You can clear
the alarms by pressing and holding the scroll (left) button for four seconds.
See Alarm Conditions, next page.
00:00:06:23:05
is is the time counter in Month:Days:Hours:Mnutes:Seconds which starts
upon power up.
Flow=0.00 Hz
e display will show the real time pulse frequency of the ow sensor input.
19