
Application Notes
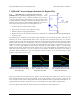
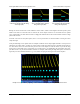
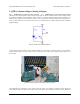
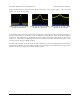
Table Of Contents
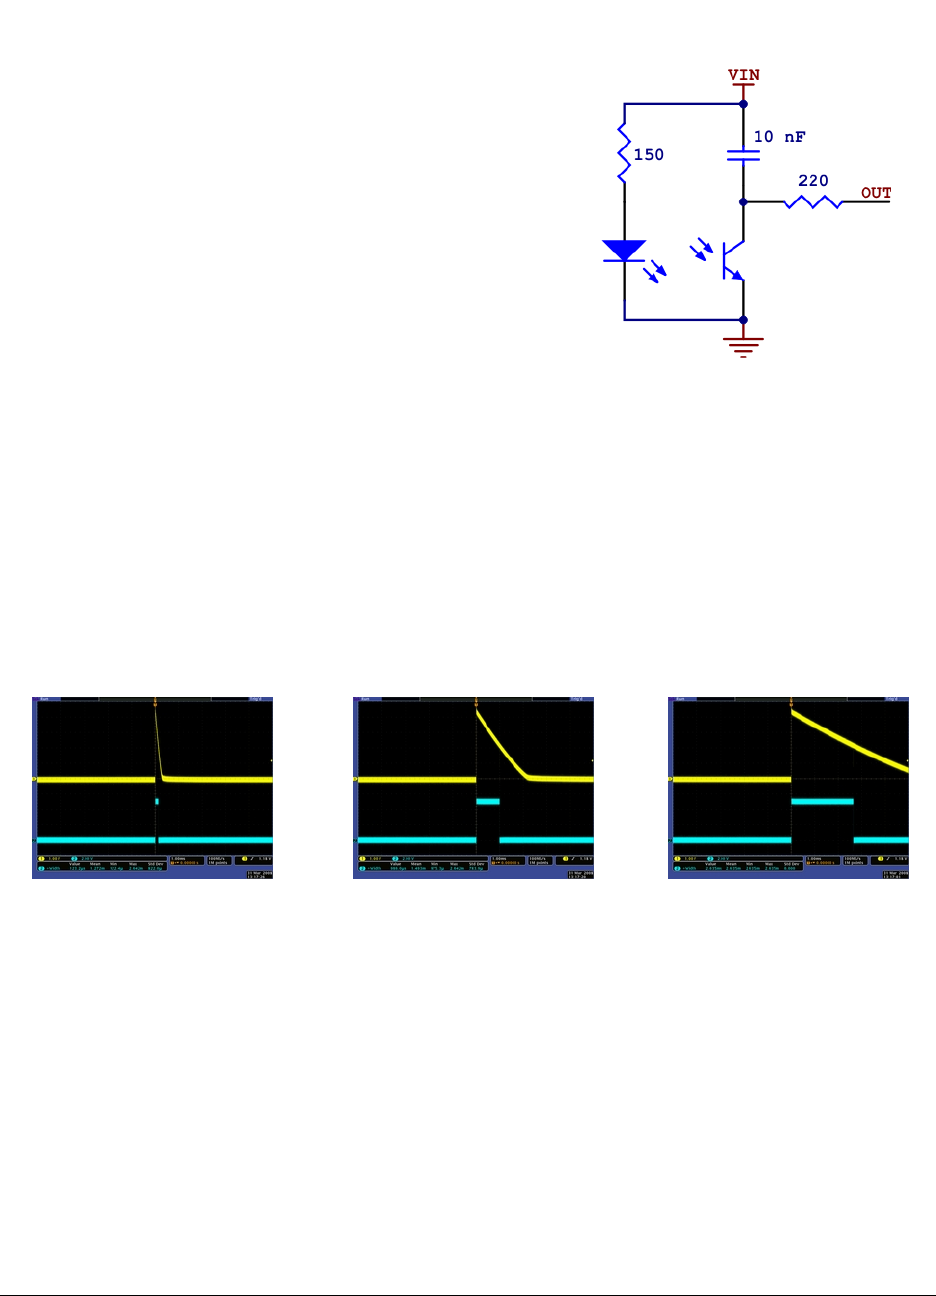
QTR-1RC reflectance sensor schematic diagram.
1. QTR-xRC Sensor Output (Intended for Digital I/Os)
Each QTR-1RC [http://www.pololu.com/catalog/product/959] and
QTR-8RC [http://www.pololu.com/catalog/product/961] reflectance sensor
phototransistor output is tied to a capacitor discharge circuit as shown
on the right, which allows a digital I/O line on a microcontroller to take
an analog reflectance reading by measuring the discharge time of the
capacitor. When you have a microcontroller’s digital I/O connected to a
sensor output, the typical sequence for reading that sensor is:
1. Set the I/O line to an output and drive it high
2. Allow at least 10 us for the 10 nF capacitor to charge
3. Make the I/O line an input (high impedance)
4. Measure the time for the capacitor to discharge by waiting for the
I/O line to go low
The following three oscilloscope screen captures below demonstrate the result of this procedure. The sensor was
positioned 1/8" above a whiteboard-like surface with a 3/4" thick piece of black electrical tape on it. The first
reading was taken over the white portion of the surface, the second reading was taken at the edge of the tape, and the
third was taken while fully over the black tape. The yellow oscilloscope channel is the sensor output and the blue
oscilloscope channel is the output of a mega168 AVR microcontroller representing its interpretation of the sensor
output. A 5 V blue signal indicates that the AVR is measuring the sensor output as “high”; a 0 V blue signal
indicates that the AVR is measuring the sensor output as “low”. In an actual application, the important value is the
width of the positive blue pulse. As you can see from the screen captures, the shorter the pulse, the more reflective
the surface. Medium-width pulses occur from moderately reflective surfaces, or as you transition from a white
surface to a black surface (or vice versa).
QTR-1RC output (yellow) when 1/8" above
a white surface and microcontroller timing
of that output (blue).
QTR-1RC output (yellow) when 1/8"
above a white/black interface and mcu
timing of that output (blue).
QTR-1RC output (yellow) when 1/8"
above a black line and microcontroller
timing of that output (blue).
Please note that these data are affected by the specifics of the test. Reflectances depend on the surfaces, and each
microcontroller will have its own trip-low threshold. In our specific example, you can see that at a height of 1/8"
above our surface, white results in a high pulse width of 120 us and black results in a high pulse width of 2.6 ms. As
the pulse width varies between 120 us and 2.6 ms, you can tell that you are approaching or leaving the line.
The screen captures below show the results of the same test conducted at a sensor height of 3/8".
Pololu QTR Reflectance Sensor Application Note © 2001–2009 Pololu Corporation
1. QTR-xRC Sensor Output (Intended for Digital I/Os) Page 2 of 5