
User's Manual


Digital ATSC Exciter-Modulator System Chapter 2,
Installation and Operating Instructions
Axcera Axciter, Rev. 0 33
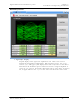
DTVision Peak to Average Screen
Peak to Average Ratio Display:
This screen shows the peak to average ratio in a statistical fashion. The red
trace shows the ideal signal's peak to average ratio statistics, and the yellow
trace shows the statistics of the transmitter's output.
The curves show the cumulative distribution function of the peak to average
ratio's probability density.
The horizontal scale shows the peak to average ratio measured in decibels.
The vertical scale shows the percentage of the time that the peak to average
ratio exceeds the value on the horizontal scale. The vertical scale is
logarithmic.
When the transmitter is clipping signal peaks, the low probability, high peak to
average portion of the (yellow) curve for the transmitter's output will appear
to the right of the (red) curve indicating the ideal signal.