
User's Manual


Digital ATSC Exciter-Modulator System Chapter 2,
Installation and Operating Instructions
Axcera Axciter, Rev. 0 29
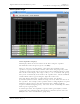
Linear Equalizer Graph
Linear Equalizer Display:
This display shows the characteristics of the linear adaptive equalizer.
The horizontal axis is frequency (0 to 5.38 MHz).
There are two traces on this display. One shows the amplitude of the
equalizer's response in decibels, and the other shows the group delay of the
equalizer in nanoseconds. The vertical scale for the amplitude display is along
the left side of the display. The range is always –3 to +3 decibels. The group
delay scale automatically scales itself to the equalizer data, and the minimum
and maximum values appear along the right side of the scale.
Since this display shows the equalizer characteristics, the channel
(transmitter) characteristics, which are being corrected, will be the inverse of
the equalizer. For example, if the equalizer shows a rising amplitude response
with increasing frequency, then the transmitter has a falling amplitude
response with increasing frequency. The same inverse relationship also holds
with respect to group delay.
In normal operation, the amplitude response will be generally flat, and the
group delay curve will drop off at the frequency extremes (near 0 and 5.38
MHz) because of the channel filter's group delay.