
User's Manual


© 2010 - 2015 Persistent Systems, LLC – All Rights Reserved 83
WEB MANAGEMENT INTERFACE REFERENCE
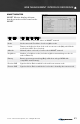
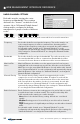
MENU ITEM MENU ITEM DESCRIP-
TION
Node Name and IP address of
each node
Result
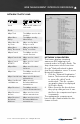
Mbps Total Total Mbps used on this
interface
Mbps Wave
Relay
®
Total Mbps used by
Wave Relay
®
Mbps Wave Re-
lay
®
Sent
Mbps used by Wave
Relay
®
to send
Mbps Wave
Relay
®
Received
Mbps used by Wave
Relay
®
to receive
Mbps Control Total Mbps used for
control functions
Mbps Control Ack Mbps used to control
ACK
Mbps Control
RTS/CTS
Mbps used to control
RTS/CTS
Mbps Other Mbps used for other
functions
Mbps Sent Total Mbps used for all
transmissions
Mbps Sent Unicast Mbps used for Unicast
transmissions
Mbps Sent Broad-
cast/Multicast
Mbps used for
Broadcast/Multicast
transmissions
Mbps Received Total Mbps used to
receive all transmissions
Mbps Received
Unicast
Mbps used to receive
Unicast transmissions
Mbps Received
Broadcast/
Multicast
Mbps used to receive
Broadcast/Multicast
transmissions
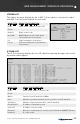
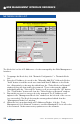
NETWORK TRAFFIC LOAD
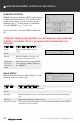
NETWORK VISUALIZATION
This feature displays situational
awareness GPS mapping for all
network nodes in Google
™
Earth. The
drop down menu selects how often
Google
™
Earth will refresh its data
from the visualization server. To access
Network Visualization:
1. Click the “Network Visualization”
button. The browser will attempt
to open a file called “node-
monitor.kml.” This file contains
geographic data to be displayed
in Google
™
Earth.
2. Either open the file directly from
the pop-up dialogue box or save
the file to the computer and open
it separately.
The management computer must
have Google
™
Earth installed for this
feature to work.