
User guide


22
Chapter 4: Main TabairFiber
®
AF5/AF5U User Guide
Ubiquiti Networks, Inc.
Remote Modulation Rate Displays the modulation rate
of the remote airFiber AF-5:
• 10x (1024QAM MIMO)
• 8x (256QAM MIMO)
• 6x (64QAM MIMO)
• 4x (16QAM MIMO)
• 2x (QPSK MIMO)
• 1x (½ Rate QPSK xRT)
• ¼x (¼ Rate QPSK xRT)
TX Capacity Displays the potential TX throughput, how
much the airFiber AF-5 can send, after accounting for the
modulation and error rates.
RX Capacity Displays the potential RX throughput, how
much the airFiber AF-5 can receive, after accounting for
the modulation and error rates.
TX Power Displays the maximum average transmit
output power (in dBm) of the airFiber AF-5.
Remote TX Power Displays the maximum average
transmit output power (in dBm) of the remote airFiber
AF-5.
Distance Displays the distance between the airFiber
radios.
GPS Signal Quality Displays Global Positioning System
(GPS) signal quality as a percentage value on a scale of
0-100%.
Latitude/Longitude Based on GPS tracking, reports the
device’s current latitude and longitude. Clicking the link
opens the reported latitude and longitude in a browser
using Google Maps
™
(http://maps.google.com).
Altitude Based on GPS tracking, reports the device’s
current altitude relative to sea level.
Synchronization airFiber uses GPS to synchronize the
timing of its transmissions. By default, this option is
disabled.
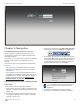
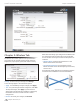
Monitor
There are two monitoring tools accessible via the links
on the Main tab. The default is Performance, which is
displayed when you first open the Main tab.
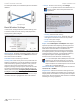
Performance
Throughput and Capacity charts display the current and
potential data traffic.
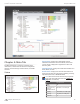
Throughput
Throughput displays the current data traffic on the Data
port in both graphical and numerical form. The chart scale
and throughput dimension (Bps, Kbps, Mbps) change
dynamically depending on the mean throughput value.
The statistics are updated automatically.
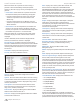
Capacity
Capacity displays the potential data traffic on the Data
port in both graphical and numerical form. The chart scale
and throughput dimension (Bps, Kbps, Mbps) change
dynamically depending on the mean throughput value.
The statistics are updated automatically.
Refresh If there is a delay in the automatic update, click
Refresh to manually update the statistics.
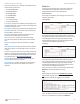
Log
When logging is enabled (see “System Log” on page
34 to enable logging), this option lists all registered
system events. By default, logging is not enabled.
Clear To delete all entries in the system log, click Clear.
Refresh To update the log content, click Refresh.