
User's Manual


15
Chapter 4: Main TabairFiber X User Guide
Ubiquiti Networks, Inc.
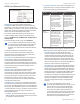
RX Capacity Displays the potential RX throughput, how
much the airFiberX radio can receive, after accounting for
the modulation and error rates.
TX Power (EIRP) Displays the current average transmit
output power (in dBm) of the airFiberX radio.
Note: If “(Limited)” is displayed, the transmit output
power has been limited to a value less than the
selected value, to comply with regulatory region
requirements. For a list of maximum output power
values by country and region, refer to “Frequency
Ranges and Power Levels per Country/Region” on
page 63.
Conducted TX Power Displays the conducted transmit
power out of the radio before any antenna gain.
Net Gain Displays the airFiberX radio’s net antenna gain,
which is the antenna gain minus cable loss. Antenna
gain (the gain of the antenna being used) and cable loss
(the loss in the cable from the radio to the antenna) are
set using the Antenna Gain and Cable Loss fields on the
Wireless tab.
Remote TX Power (EIRP) Displays the current average
transmit output power (in dBm) of the remote airFiberX
radio.
Distance Displays the distance between the airFiberX
radios.
GPS Signal Quality Displays Global Positioning System
(GPS) signal quality as a percentage value on a scale of
0-100%.
Latitude/Longitude Based on GPS tracking, reports the
device’s current latitude and longitude. Clicking the link
opens the reported latitude and longitude in a browser
using Google Maps
™
(http://maps.google.com).
Altitude Based on GPS tracking, reports the device’s
current altitude relative to sea level.
Synchronization airFiber uses GPS to synchronize the
timing of its transmissions. By default, this option is
disabled.
Ethernet
MGMT MAC Displays the MAC address of the
Management port.
MGMT Displays the speed and duplex of the
Managementport.
DATA Displays the speed and duplex of the Data port.
DATA Cable Length Displays the Ethernet cable length
from radio to remote port. This is displayed only for cables
longer than 20 m.
DATA Pair 0 (Pins 1,2) If the cable is functioning properly,
displays the SNR of the twisted pair; if the cable has a
fault, displays the fault (“open” or “short”) and the distance
at which the fault has occurred. If the remote port is
administratively shut down, this field displays “normal”.
DATA Pair 1 (Pins 3,6) If the cable is functioning properly,
displays the SNR of the twisted pair; if the cable has a
fault, displays the fault (“open” or “short”) and the distance
at which the fault has occurred. If the remote port is
administratively shut down, this field displays “normal”.
DATA Pair 2 (Pins 4,5) If the cable is functioning properly,
displays the SNR of the twisted pair; if the cable has a
fault, displays the fault (“open” or “short”) and the distance
at which the fault has occurred. If the remote port is
administratively shut down, this field displays “normal”.
DATA Pair 3 (Pins 7,8) If the cable is functioning properly,
displays the SNR of the twisted pair; if the cable has a
fault, displays the fault (“open” or “short”) and the distance
at which the fault has occurred. If the remote port is
administratively shut down, this field displays “normal”.
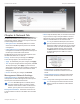
Monitor
There are two monitoring tools accessible via the links
on the Main tab. The default is Performance, which is
displayed when you first open the Main tab.
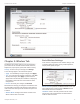
Performance
Throughput and Capacity charts display the current and
potential data traffic.
Throughput
Throughput displays the current data traffic on the Data
port in both graphical and numerical form. The chart scale
and throughput dimension (Bps, Kbps, Mbps) change
dynamically depending on the mean throughput value.
The statistics are updated automatically.
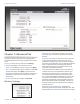
Capacity
Capacity displays the potential data traffic on the Data
port in both graphical and numerical form. The chart scale
and throughput dimension (Bps, Kbps, Mbps) change
dynamically depending on the mean throughput value.
The statistics are updated automatically.
Refresh If there is a delay in the automatic update, click
Refresh to manually update the statistics.