
Reference Guide

40
Using traffic information
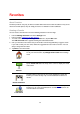
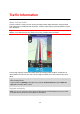
The traffic bar shows all the major traffic incidents as they occur on your route. Glowing dots show
where the incidents are located on the route.
The total delay caused by traffic incidents on your route is shown at the top
of the traffic bar.
The central section of the traffic bar shows individual traffic incidents in the
order they occur on your route.
The bottom of the traffic bar represents your current location.
The distance to the first traffic incident is shown at the bottom of the traffic
bar.
To improve visibility on the traffic bar, some minor incidents may not be
shown.
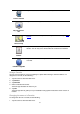
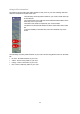
The total delay caused by traffic incidents on your route is shown using different colors on the traffic
bar:
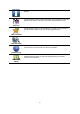
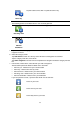
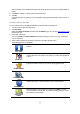
No color - No traffic incidents on your route
Yellow - There is heavy traffic on your route
Orange - There is slow traffic on your route
Red - There is stationary traffic on your route.