
Operating Manual


Chapter 9 Security, Service & Diagnostics Accu-Wave
9-8 TN Technologies
View marker report
Before viewing any of the marker report items with direct entry, you must enter command
13 to tell the system to prepare the data.
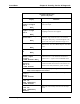
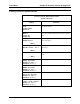
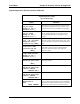
“View Marker Report” Menu
[Service only item]
Display Comments
View marker report→→
NEXT↓↓
Submenu of “Snapshot” Submenu. Reports relative
control levels at which RF frequency markers occur.
Sweep drive range =
2031
(-32.60 to 1999)
NEXT↓↓
MARKER #0= -32.60
delta to #1 = 104.9
slope delta=98.85%
%NonLIN=0.000
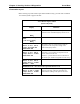
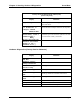
The marker values are relative figures which are
proportional to the sweep drive voltage at the
indicated frequency marker.
MARKER #1 = 72.20
delta to #2 = 208.4
slope delta =-2.591%
%NonLIN=2.592
delta = difference between two markers values.
slope delta = percent change in slope between one
pair of markers and the next.
NonLin% = percent difference between the delta of
this marker pair and the average delta over the sweep.
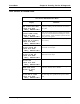
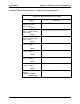
MARKER #2 = 280.6
delta to #3 = 203.0
slope delta =-1.923%
NonLIN = .9292
MARKERS #3-10 – above menu items repeated for markers 3-10.
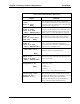
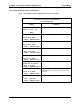
marker #11 = 1999
delta to #12 = 0.000
slope delta = 0.000%
%NonLIN=0.000
Marker #11 is dummy marker covering only part of a
frequency sub-range. Thus, the slope delta and
%NonLin data relating to this point is not useful.