
Interpolated Control (VIC) Port Reference Guide

Video Port Throughput and Latency
2-15Video PortSPRU629
2.6.2 Video Display Throughput
Video display throughput may be calculated in a manner similar to video capture.
In this case, the time to fill the display FIFO must be less than the time to empty
the FIFO or underflow occurs. The 110 MHz display rate supports a maximum
display resolution of 1280 × 1024 at 63 Hz (frame rate). This means that the
horizontal blanking time is ~3.88 µs. The time to empty a completely full FIFO
may be represented by the formula t
E
+ n(t
H
), where t
E
is the time to empty the
FIFO of active samples, t
H
is the horizontal blanking time, and n is the number
of lines of active video that the FIFO can hold. In raw display mode, the FIFO
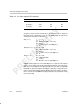
is 5120 bytes. The number of samples that the buffer can hold depends on the
buffer packing mode as listed in Table 2–3.
Table 2–3. Raw Video Display FIFO Capacity
8-Bit 10-Bit Dense 10/16-Bit 20-Bit
Samples 5120 3840 2560 1280
Using these values and the formula above, the maximum time to fill the FIFO
(t
I
) may be calculated for each case. The DMA input rate (r
I
) is then calculated
as the FIFO size divided by t
I
:
8-bit (n=4): t
I
< t
E
+ n(t
H
)
t
I
< 5120/110 MHz + 4(3.88 µs)
t
I
< 62.6 µs
r
I
= t
I
/5120 = 12.12 ns (82.5 MBytes/s)
10-bit dense (n=3): t
I
< t
E
+ n(t
H
)
t
I
< 3840/110 MHz + 3(3.88 µs)
t
I
< 46.55 µs
r
I
= t
I
/5120 = 9.09 ns (110 MBytes/s)
16-bit (n=2): t
I
< t
E
+ n(t
H
)
t
I
< 2560/110 MHz + 2(3.88 µs)
t
I
< 31.03 µs
r
I
= t
I
/5120 = 6.06 ns (165 MBytes/s)
20-bit (n=1): t
I
< t
E
+ n(t
H
)
t
I
< 1280/110 MHz + 1(3.88 µs)
t
I
< 15.52 µs
r
I
= t
I
/5120 = 3.03 ns (330 MBytes/s)