
Datasheet


TMP104EVM Software Overview
www.ti.com
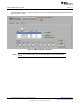
5.2.6 Temperature Graphs Tab
In Continuously Read and Plot All Reg mode, the respective value for each of the local temperature
sensors on the TMP104EVM is plotted in degrees Celsius (°C). Figure 18 shows the Temperature Graphs
tab.
Figure 18. Temperature Graphs Tab
16
TMP104EVM Evaluation Board and Software Tutorial SBOU118–October 2011
Submit Documentation Feedback
Copyright © 2011, Texas Instruments Incorporated