
Application Guide


- Tap Analyze to choose analysis options such as add a moveable line, plot a
value or function, or activate the Graph Trace tool.
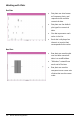
Working with Charts
Dot Charts
• The default plot type for
categorical data is the dot
chart.
• When one variable is
plotted, the value of each
cell is represented as one
dot.
• The dots are stacked at the
point on the axis that
corresponds to the cell
value.
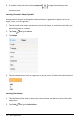
Bar Charts
• Bar charts display
categorical data.
• The length of the bar
represents the number of
cases in the category.
Data & Statistics Application 128