
Application Guide

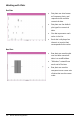


Histograms
• A histogram plots one-
variable numerical data
and depicts the
distribution of data.
• The number of bins
displayed depends on the
number of data points and
how the points are
distributed.
• A value that occurs on the
edge of a bin is counted in
the bin to its right.
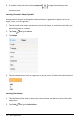
Normal Probability Plots
Shows one set of numerical data
against the corresponding
quartile (z) of the standard
normal distribution.
Data & Statistics Application 126