
Application Guide


125 Data & Statistics Application
Working with Plots
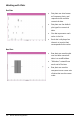
Dot Plots
• Dot plots are also known
as frequency plots, and
represent one-variable
numerical data.
• Dot plots are the default
plot type for numerical
data.
• One dot represents each
value in the list.
• Each dot is displayed on
the axis at a point that
corresponds to the value.
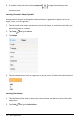
Box Plots
• Box plots are used to plot
one-variable numerical
data in a modified box.
• "Whiskers" extend from
each end of the box.
• Box plots are used to
compare two or more sets
of data that use the same
scale.