
Application Guide


123 Data & Statistics Application
-OR-
Drag either axis to shift the axis while retaining its scale.
To restore the original size and location of the plotted data, tap Tools > Window/Zoom
> Zoom-Data.
Plotting a Value
When you plot a value on an existing plot, it is displayed as a vertical line in the work
area. You can plot a single number or any expression that evaluates to a number. If the
value is dependent on the data, the line updates to reflect changes made when you
drag a point or make changes in the Lists &Spreadsheet application. The plotted value
must be in the domain of the axis.
To plot a value:
1. Tap Tools , go to Analyze, and then tap Plot Value.
2. Type the value you want to plot, and then tap ENTER.
Plotting a Function
Use Plot Function to graph a function for comparison to an existing plot. To plot a
function:
1. Create or open a problem that includes variables that are plotted in a Data
&Statistics work area. Ensure the work area contains both a horizontal axis and a
vertical axis.
2. Tap Tools , go to Analyze, and then tap Plot Function.
3. Type the function in the entry field and tap return.
Note: You can rename the function by typing over f1(x): with another name.
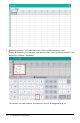
Adding a Data &Statistics Page
To get started with the Data &Statistics application, add a Data &Statistics page to an
existing document that contains a Lists &Spreadsheet page.
1. Tap Add, and then tap .
The Data &Statistics page shows the default case plot.