
Application Guide


A capture expression is inserted.
5. Replace the letters “var” with the name of the variable to capture.
Note: You can also select the variable name from the Variables menu by tapping
var, and then tapping the desired variable.
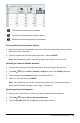
Using Table Data for Statistical Analysis
Tools on the Statistics menu provide access to wizards that help you perform statistical
analyses on the data in table columns. You specify the location of the data, and the
Lists & Spreadsheet application stores the results in two columns: one for the result
names, and one for the corresponding values.
Statistical Calculations and Results
You can perform statistical calculations to analyze data.
Performing Statistical Calculations
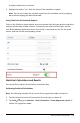
Note: The following example fits a y=mx+b linear regression model to two lists.
1. Tap the column formula cell (second cell from the top) in column A.
2. Tap Tools and go to Statistics > Stat Calculations > Linear Regression (mx+b) to
choose the regression model.
Lists & Spreadsheet Application 110