
Application Guide


462 Data Collection
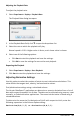
Selecting an Independent Variable Column
Use the option Select X-axis Column to select the column used as the independent
variable when graphing the data. This column is used for all graphs.
1. Click Graph > Select X-axis Column.
2. Select the variable you want to change.
The x-axis label on the graph changes and the graph is reordered using the new
independent variable for graphing the data.
Selecting a Dependent Variable Column
Use the option Select Y-axis Column to select which dependent variable columns to
plot on the displayed graph(s).
1. Click Graph > Select Y-axis Column.
2. Select one of the following:
• A variable from the list. The list is a combination of dependent variables and
the number of data sets.
• More. Selecting More opens the Select dialog box. Use this when you want to
select a combination of data set variables to graph.
Showing and Hiding Details
You can hide or show the Details view on the left side of the screen.
▶ Click Options > Hide Details or Options > Show Details.