
Application Guide


4. Click OK to save the setting.
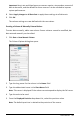
Selecting a Range of Data
Selecting a range of data on the graph is useful in several situations, such as when
zooming in or out, striking and unstriking data, and examining settings.
To select a range:
1. Drag across the graph.
The selected area is indicated by gray shading.
2. Perform one of these actions.
• Zoom in or out
• Strike or unstrike data
• Examine settings
To deselect a range:
▶ Press the Esc key as necessary to remove the shading and the vertical trace line.
Zooming In on a Graph
You can zoom in on a subset of the collected points. You can also zoom out from a
previous zoom or expand the graph window beyond the data points collected.
To zoom in on a graph:
1. Select the area you want to zoom into, or use the current view.
2. Click Graph > Zoom In.
The graph adjusts to display only the area you selected.
The x range selected is used as the new x range. The y range autoscales to show all
graphed data points in the selected range.
Zooming Out of a Graph
▶ Select Graph > Zoom Out.
The graph is now expanded.
Data Collection 459