
Application Guide
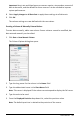


2. The Detail view shows a list of available data sets.
3. Use the check boxes to select the data sets to plot.
Autoscaling a Graph
Use the autoscale option to show all the points plotted. Autoscale Now is useful after
you change the x and y axis range or zoom in or out of a graph. You can also define the
automatic autoscale setting to use during and after a collection.
Autoscale Now Using the Application Menu
▶ Click Graph > Autoscale Now.
The graph now displays all the points plotted.
Autoscale Now Using the Context Menu
1. Open the context menu in the graph area.
2. Click Window/Zoom > Autoscale Now.
The graph now displays all the points plotted.
Data Collection 457