
Application Guide


454 Data Collection
Customizing the Graph of Collected Data
You can customize the Graph view by adding a title, changing colors, and setting
ranges for the axis.
Adding a Title
When you add a title to a graph, the title is displayed in the View Details area. When
you print the graph, the title prints on the graph.
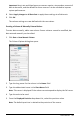
1. Click Graph > Graph Title.
The Graph Title dialog box opens.
If there are two graphs in the work area, the dialog box has two title options.
2. Type the name of the graph in the Title field.
—or—
a) Type the name of the first graph in the Graph 1 field.
b) Type the name of the second graph in the Graph 2 field.
3. Select Enable to show the title.
Note: Use the Enable option to hide or show the graph title as needed.
4. Click OK.