
Application Guide


Graph1 and Graph 2 are displayed.
Displaying Graphs in the Page Layout View
Use the Page layout view when Show Graph is not the appropriate solution for
showing more than one graph.
The Show Graph option is not applicable for:
• Multiple runs using a single sensor.
• Two or more of the same sensors.
• Multiple sensors that use the same column(s) of data.
To use Page Layout:
1. Open the original data set you want to see in two graph windows.
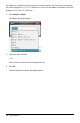
2. Click Edit > Page Layout > Select Layout.
3. Select the type of page layout you want to use.
4. Click Click here to add an application.
5. Select Add Vernier DataQuest™.
The Vernier DataQuest™ application is added to the second view.
6. To see separate views, click the view you want to change, and then select View >
Table.
The new view is displayed.
7. To show the same view, click the view to change.
8. Click View > Graph.
The new view is displayed.
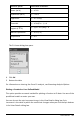
Displaying Collected Data in Table View
Table view provides another way to sort and view collected data.
Selecting the Table View
▶ Click the Table View tab .
Data Collection 449