
Application Guide


442 Data Collection
If status=0 Then
Disp "ready"
For n,1,50
RefreshProbeVars status
temperature:=meter.temperature
Disp "Temperature: ",temperature
If temperature>30 Then
Disp "Too hot"
© Play a tone on the Hub
Send "SET SOUND 440 TIME 2"
EndIf
© Wait for 1 second between samples
Wait 1
EndFor
Else
Disp "Not ready. Try again later"
EndIf
EndPrgm
Analyzing Collected Data
In the Vernier DataQuest™ application, use Graph View to analyze data. Start by
setting up graphs, and then use analysis tools such as integral, statistics, and curve fit
to investigate the mathematical nature of the data.
Important: The Graph menu and Analyze menu items are only available when working
in Graph View.
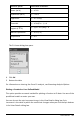
Finding the Area Under a Data Plot
Use Integral to determine the area under a data plot. You can find the area under all of
the data or a selected region of the data.
To find the area under a data plot:
1. Leave the graph unselected to examine all the data, or select a range to examine a
specific area.
2. Click Analyze > Integral.
3. Select the plotted column name if you have more than a single column.
The data plot area is displayed in the View Details area.
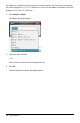
Finding the Slope
Tangent displays a measure of the rate at which the data is changing at the point you
are examining. The value is labeled “Slope.”
To find the slope: