
Application Guide


Using Shade Under Function
Use Shade Under Function to find the area of a selected region under a function
graphed in the work area.
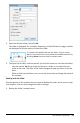
1. Select any function graphed in the Data&Statistics work area. For example, select
a previously graphed normal PDF.
2. From the Analyze menu, click Shade Under Function.
The pointer becomes a dotted vertical line and the boundary +/- ˆ displays when
you position the mouse near the boundary on the left or right. You can click when ˆ
displays to set it as a boundary.
3. Select a point on the curve and click to indicate where to start shading under the
function. The direction in which you move next determines whether the region
shaded is on the left, right, or center of the curve.
4. Select a point on the curve and click to indicate the end boundary of the shaded
area. A region under the function is shaded based on the points you selected.
You can work with Shade Under Function in the following ways:
• Select the region to display the values for data points in the shaded area.
• To remove the shading, right-click or Ctrl-click the shaded region and choose
Remove Shaded Region.
• To change the fill color of the shaded area, right-click or Ctrl-click the shaded
region, choose Color, choose Fill, and click a color.
Data&Statistics Application 385