
Application Guide


The Variable Bin Width Settings dialog box opens.
3. Select your boundary list as the List of Bin Boundaries.
4. Click OK to apply the changes and redraw the bins.
Note: You cannot change variable bin widths by dragging their boundaries; you
must edit the list of boundaries or restore equal-width bins.
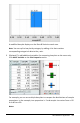
Creating a Normal Probability Plot
A normal probability plot shows one set of data against the corresponding quartile (z)
of the standard normal distribution. You can use normal probability plots to judge the
appropriateness of the normal model for your data.
1. Choose or create the data you want to use for a normal probability plot. Use a
named list from Lists&Spreadsheet or Calculator.
2. Plot the data in one of the following ways:
- Create a dot plot by selecting a column and choosing QuickGraph.
- Add a Data&Statistics work area. Click the Add Variable region on an axis and
click the data list name to plot the variable.
3. On the Plot Types menu, click Normal Probability Plot.
The data graphs in the Data&Statistics work area. You can examine the graph to
compare the normal variable against the quartile.
4. Explore the data represented in the normal probability plot.
- Hover over a data point to display its value.
Data&Statistics Application 359