
Application Guide


2. Enter or select the settings, and click OK to apply them.
3. If you are not already tracing, your new settings take effect the next time you
trace.
Example: Creating an Animated 3D Graph
1. Insert a new problem and select the 3D Graphing view.
2. From the Actions menu, select InsertSlider, click to position it, and type time as
the variable name.
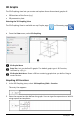
3. Display the slider’s context menu, click Settings, and enter the following values.
Value: 3.8
Minimum: 3.2
Maximum: 4.4
Step Size: 0.1
4. In the entry line, define the function shown here:
5. Drag the slider thumb to see the effect of varying time.
6. Add visual interest. For example:
3D Graphs 249