
Application Guide


Changing the Appearance of a 3D Graph
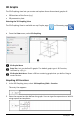
Setting Wire and Surface Color:
1. Display the graph’s context menu, click Color, and then click LineColor or FillColor.
2. Click a color swatch to apply it.
Setting Custom Plot Colors:
You can assign different colors to a graph's top and bottom surfaces or choose to have
the graph colored automatically, based on height or steepness. You can also set the
wire color.
1. Display the graph’s context menu, and then click Color > CustomPlotColor.
2. Select one of the three Surface color options: Top/bottom color, Vary color by
height, or Vary color by steepness.
- If you choose Top/bottom color, click the color swatches to select colors for the
top and bottom surfaces.
- If you choose to vary color by height or steepness, colors are determined
automatically.
3. To set the Wire color, click the color swatch and select a color.
Setting Other Attributes of a Graph:
1. Display the graph’s context menu, and then click Attributes. You can set the
following attributes for the selected graph.
- format: surface+wire, surface only, or wire only
3D Graphs 245