
Application Guide


198 Graphs Application
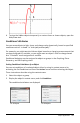
3. (Optional) In the Show When field, enter an expression specifying the conditions
during which the object will be shown. Anytime the condition is not satisfied, the
object will be hidden.
You can specify tolerance by using compound conditionals in the Show When input
field. For example, area>=4andarea<=6.
Note: If you need to see conditionally hidden objects temporarily, click
Actions>Hide/Show. To return to normal viewing, press ESC.
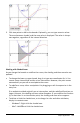
4. (Optional) Enter numbers or expressions that evaluate to numbers in the applicable
color fields, such as Line Color or Mesh Color. To see a map of color values, click
the Colors button.
Map of conditional color values
5. Click OK in the Conditional Attributes dialog box to apply the conditions.
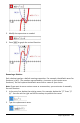
Calculating a Bounded Area
Note: To avoid unexpected results when using this feature, make sure the
documentsetting for "RealorComplexFormat" is set to Real.
When you calculate the area between curves, each curve must be:
• A function with respect to x.
- or -
• An equation in the form y=, including y= equations defined through a text box or a
conicequation template.
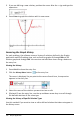
Defining and Shading the Area
1. From the Analyze Graph menu, select Bounded Area.
If exactly two appropriate curves are available, they are selected automatically,
and you can skip to step 3. Otherwise, you are prompted to select two curves.
2. Click two curves to select them.
– or –
Click one curve and the x axis.
You are prompted to set the lower and upper bounds.