
Application Guide


196 Graphs Application
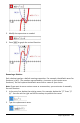
Changing the Appearance of the Graph Axes
1. From the Actions menu, click Attributes.
2. Click either axis.
3. Press ▲and▼ to move to the desired attribute, and then press ◄and► to
choose the option to apply.
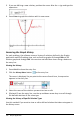
Note: To hide the axes or selectively hide or show an individual axis end-value, use the
Hide/Show tool.
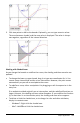
Hiding and Showing Items in the Graphs Application
The Hide/Show tool reveals objects you have previously selected as hidden and lets you
select which objects to show or hide.
Note: If you hide a graph, its expression is automatically marked as hidden in the graph
history.
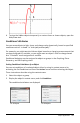
1. From the Actions menu, select Hide/Show.
The Hide/Show tool appears at the top of the work area, and currently hidden
items (if any) are shown dimmed.
2. Click objects to toggle their hide/show status. You can hide graphs, geometric
objects, text, labels, measurements, and individual axis end-values.
3. Press Esc to complete your selections and close the tool.
All objects you selected as hidden objects disappear.