
Application Guide


190 Graphs Application
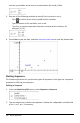
when plotting autonomous equations. You can change this parameter
only if Field = Direction.
Viewing Tables from the Graphs Application
You can show a table of values for any relation defined in the current problem.
Note: For details about using tables and instructions for accessing tables from the
Lists&Spreadsheet application, see Working with Tables.
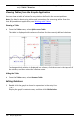
Showing a Table
▶ From the Table menu, select Split-screenTable.
The table is displayed with columns of values for the currently defined relations.
To change which relation is displayed in a column, click the arrow in the top cell of
the column, and then select the relation name.
Hiding the Table
▶ From the Table menu, select RemoveTable.
Editing Relations
1. Double-click the graph to show its expression in the entry line.
—or—
Display the graph’s context menu, and then click EditRelation.