
User Manual
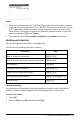
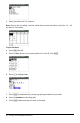


Table Of Contents
- Important Information
- Using Your TI-84 Plus CE Graphing Calculator
- Using the Keyboard
- Setting Up the Calculator Modes
- Evaluating Expressions
- Working with Graphs
- Working with Matrices
- Working with Probability and Statistics
- Working with Variables
- Managing Calculator Files
- Using Applications (Apps)
- Using Accessories
- Using Press-to-Test
- Diagnosing and Correcting Error Conditions
- General Information
- Index

38 Working with Probability and Statistics
3. Enter your data into list columns.
Note: Once in the list editor, use the arrow keys to enter the data in the lists. L1 – L6
are built-in list names.
To plot this data:
4. Press y ,.
5. Press 1: Plot1 (to set up a scatter plot for L1 and L2), then Í.
6. Press | to highlight On.
7. Press q to automatically set up a graphing window for your data.
8. Press 9: ZoomStat to see the graph.
9. Press r and arrow keys to trace on the plot.