
manual

22 Using the Scratchpad
• If the axes are hidden on the page, selecting this tool redisplays
them.
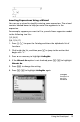
Tracing a Plot
Graph Trace moves through the points of a graphed function,
parametric, polar, sequence, or scatter plot. To enable the trace tool:
1. Press
b > Trace > Graph Trace (b51) to move across the
plot in Trace model.
2. (Optional) To change the trace step increment for tracing, press
b53.
After you type a different step increment, the Graph Trace tool moves
across the graph in steps of that size.
3. Use Graph Trace to explore a plot in the following ways:
• Move to a point and hover to move the trace cursor to that point.
• Press
¡ or ¢ to move from point to point on the function’s graph.
The coordinates of each point traced are displayed.
• Press
£ or ¤ to move from one plot to another. The point’s
coordinates update to reflect the new location of the trace. The
trace cursor is positioned on the point of the new graph or plot
with the closest x value to the last point identified on the
previously traced function or graph.
• Type a number and press
· to move the trace cursor to the
point on the plot with independent coordinates nearest the typed
value.