
Datasheet


−21
−18
−15
−12
−9
−6
−3
0
3
1 10 100 300
Frequency ( MHz)
Normalized Gain (dB)
Bias 15
Bias 10
Bias 5
Bias 0
V
O
= 2V
PP
R
L
= 60Ω
−21
−18
−15
−12
−9
−6
−3
0
3
1 10 100 300
Frequency ( MHz)
Normalized Gain (dB)
Bias 15
Bias 10
Bias 5
Bias 0
V
O
= 10V
PP
R
L
= 60Ω
-12.5 -9.5 -6.5 -3.5 -0.5 20.5
100
400
450
500
550
600
650
OutputPower(dBm)
PowerConsumption(mW)
2.5 5.5
Prof.30,Bias10
Prof.17,Bias4
Prof.8,Bias2
ADSL,Bias0
350
300
250
200
150
8.5 11.5 14.5 17.5
OutputPowerInto100 Load
LoadPowerIncluded
W
-350 -250 -150 -50 50 350
0
2
4
6
8
10
12
I (mA)
O
V (V)
O
1WInternal
Power
Dissipation
Bias15
ClassABMode
1WInternal
Power
Dissipation
150 250
100 LoadLineW
50 LoadLineW
25 LoadLineW
0 20 40 60 80 100 120 140 160 180 200
0.27
0.21
0.16
0.11
0.05
0
0.05
0.11
0.16
0.21
0.27
-5
-4
-3
-2
-1
0
1
2
3
4
5
Time(ns)
InputVoltage(V)
OutputVoltage(V)
R =60W
L
AC-CoupledInputandOutput
OutputVoltage
RightScale
InputVoltage
LeftScale
0.6 0.7 0.8 0.9 1 1.1 1.2 1.3 1.4 1.5 1.6
-0.21
-0.11
0
0.11
0.21
0.32
0.43
0.53
0.64
0.75
-4
-2
0
2
4
6
8
10
12
14
Time(ns)
InputVoltage(V)
OutputVoltage(V)
InputVoltage
LeftScale
OutputVoltage
RightScale
R =60W
L
AC-Coupled
InputandOutput
PositiveExcursionOnly
THS6226
www.ti.com
SBOS499C –JANUARY 2011–REVISED APRIL 2011
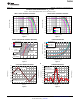
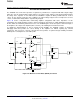
TYPICAL CHARACTERISTICS: V
S
= +12V
At T
A
= +25°C and Full Bias Mode, unless otherwise noted
SMALL-SIGNAL FREQUENCY RESPONSE LARGE-SIGNAL FREQUENCY RESPONSE
Figure 2. Figure 3.
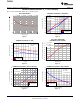
OUTPUT VOLTAGE AND CURRENT LIMITATIONS POWER CONSUMPTION
Figure 4. Figure 5.
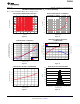
CLASS AB OVERDRIVE RECOVERY OVERDRIVE RECOVERY
Figure 6. Figure 7.
Copyright © 2011, Texas Instruments Incorporated Submit Documentation Feedback 7
Product Folder Link(s): THS6226