
Datasheet


3−46
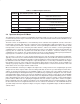
Table 3−7. DRC Example 4 Parameters
DRC
PARAMETER
REQUIRED (SPECIFIED) VALUE
(NET GAIN
SAP
Input-DRC
= 0 dB)
I
2
C COEFFICIENT VALUE
T2 −22 dB
Input
≥ −70 dB
DRC
−70/−6.0206 = 11.626748
= 0x0000 05D0 3948
25.23
format
T1 −102 dB
Input
≥ −150 dB
DRC
−150/−6.0206 = 24.91446
= 0x0000 0C75 0D09
25.23
format
O2 100 dB
(100 + 24.0824)/6.0206= 20.609640
= 0x0000 0A4E 08B0
25.23
format
O1 0 dB
(0 + 24.0824)/6.0206 = 4.000000
= 0x0000 0200 0000
25.23
format
k2 1:1.4 expansion 1.4 − 1 = 0.4 = 0x0333 333
5.23
format
k1 1:−1 transfer (1/−1) − 1 = −1 −1 = −2 = 0XF000000
5.23
format
k0 1:1.5 expansion 1.5 − 1 = 0.5 = 0x0400 000
5.23
format
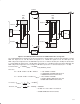
3.8 Spectrum Analyzer/VU Meter
The TAS3103A contains an I
2
C bus programmable function block that can serve as either a spectrum analyzer or
a volume unit (VU) meter. Figure 3−29 shows the structure of this function block and lists the I
2
C subaddress of the
parameters that control it.
The block consists of 10 biquad filters, each followed by an rms estimator and a logarithmic converter. Two nodes
provide input to the block, with each node servicing five of the 10 biquad filters. Audio from input node s can either
come exclusively from channel 1, channel 2, channel 3, or from a gain-weighted combination of these channels. Audio
from input node t can also come exclusively from either channel 1, channel 2, or channel 3, or from a gain-weighted
combination of these channels. The spectrum analyzer then can be used to divide the audio frequency band into 10
frequency bins to examine the spectrum of the audio data stream on channel 1, channel 2, channel 3, or any
combination of these channels. The spectrum analyzer can also be used to divide the audio frequency band into five
frequency bins to examine the spectral content of two of the channels independently.
The VU meter is a special case of the spectrum analyzer that uses only the outputs from biquad 5 and biquad 6.
Typically, for the VU meter, one channel would be routed to biquad 5 (node s) and a different channel would be routed
to biquad 6 (node t). Each biquad filter would be assigned a band-pass transfer function that encompasses most of
the audio band, or the filter could be configured as a pass-through device to see the full spectral band. The two outputs
then would be a measure of the energy on the two channels. Other options for the VU meter are also available. For
example, by properly setting the coefficients on biquad 5 and biquad 6, the concurrent measurement of bass and
treble volume levels on a single channel could be made.
Mixer and summation elements preceding the two input nodes s and t provide a means of adjusting the spectrum
analyzer and VU meter outputs relative to the incoming audio data stream. The spectrum analyzer and VU meter
outputs are unsigned 5.3-format, base-2 logarithmic numbers. The integer part of the number designates the
most-significant bit [in the 48-bit digital audio processor(DAP) word] occupied by the magnitude of the rms estimate
of the biquad filter output. A value of 31 means the magnitude of the rms estimate occupies bit 47 of the 48-bit DAP
word (bit 48 is the sign bit, and using the absolute value of the biquad filter output in determining the rms estimate
makes this bit always 0 in value). A value of 30 means the magnitude of the rms estimate occupies bit 46 and this
pattern continues with a value of 1 signifying the magnitude of the rms estimate occupies bit 17. A value of 0 signifies
that the magnitude of the rms estimate is below bit 17. The fractional digits in the 5.3-formatted number are simply
the three bits below the most-significant data bit. If the rms estimate lies below bit 16 of the 48-bit DAP word, the
spectrum analyzer/VU meter output is 0.0. Figure 3−27 gives examples of logarithmic outputs for different 48-bit rms
estimate values.