
Datasheet


Table Of Contents
- FEATURES
- APPLICATIONS
- DESCRIPTION
- ABSOLUTE MAXIMUM RATINGS
- RECOMMENDED OPERATING CONDITIONS
- PACKAGE SPECIFICATIONS
- ELECTRICAL CHARACTERISTICS
- PIN ASSIGNMENT
- TYPICAL CHARACTERISTICS (5-V INPUT) The electrical characteristic data has been developed from actual products tested at 25°C. This data is considered typical for the converter. Applies to , , and . The temperature derating curves represent the conditions at which internal components are at or below the manufacturer's maximum operating temperatures. Derating limits apply to modules soldered directly to a 100-mm × 100-mm, double-sided PCB with 2-oz. copper. Applies to .
- TYPICAL CHARACTERISTICS (12-V INPUT) The electrical characteristic data has been developed from actual products tested at 25°C. This data is considered typical for the converter. Applies to , , and . The temperature derating curves represent the conditions at which internal components are at or below the manufacturer's maximum operating temperatures. Derating limits apply to modules soldered directly to a 100-mm × 100-mm, double-sided PCB with 2-oz. copper. Applies to .
- APPLICATION INFORMATION
- REVISION HISTORY
0
0.25
0.5
0.75
1
0 0.5 1 1.5 2 2.5
V
O
= 5 V
V
O
= 3.3 V
V
O
= 2.5 V
V
O
= 1.2 V
I
O
− Output Current − A
− Power Dissipation − W
P
D
V
O
= 1.8V
V
O
= 1.5 V
20
30
40
50
60
70
80
90
0.25 0.75 1.25 1.75 2.25
Airflow
Nat Conv
I
O
− Output Current − A
Temperature Derating − 5 C
50
60
70
80
90
100
0 0.5 1 1.5 2 2.5
V
O
= 5 V
V
O
= 3.3 V
V
O
= 2.5 V
V
O
= 1.8 V
V
O
= 1.5 V
V
O
= 1.2 V
Efficiency − %
I
O
− Output Current − A
0
20
40
60
80
100
0 0.5 1 1.5 2 2.5
V
O
= 2.5 V
V
O
= 1.5 V
V
O
= 1.2 V
V
O
= 5 V
V
O
= 3.3 VV
O
= 1.8 V
I
O
− Output Current − A
− Output Voltage Ripple − mV
V
O PP
PTH08080W
SLTS235D –FEBRUARY 2005–REVISED SEPTEMBER 2013
www.ti.com
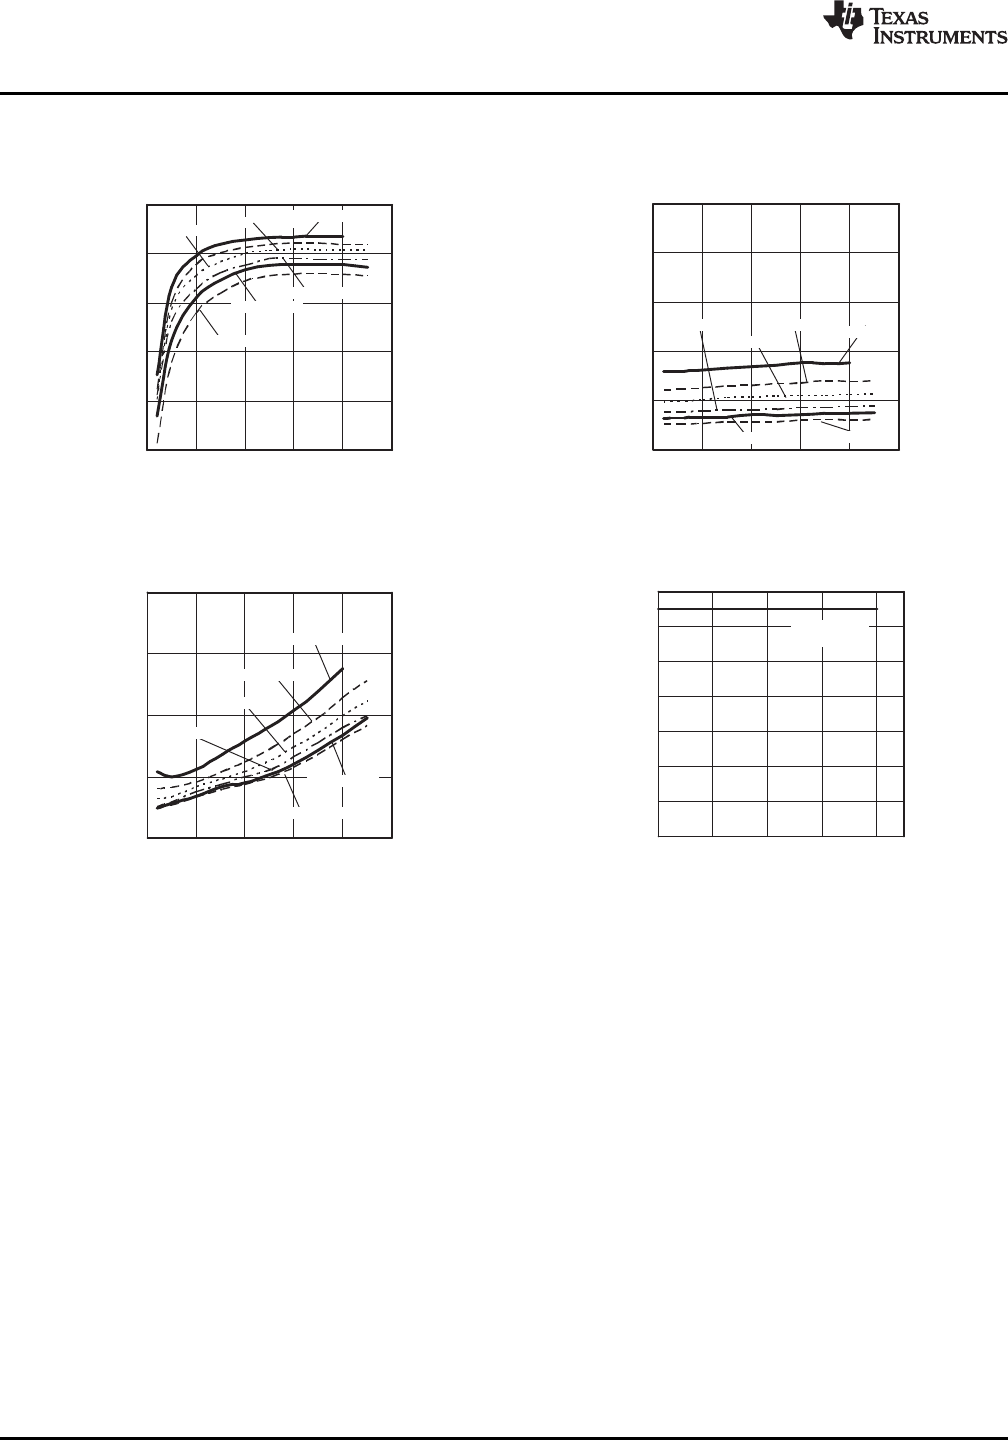
TYPICAL CHARACTERISTICS (12-V INPUT)
(1) (2)
EFFICIENCY OUTPUT RIPPLE
vs vs
OUTPUT CURRENT OUTPUT CURRENT
Figure 6. Figure 7.
POWER DISSIPATION TEMPERATURE DERATING
vs vs
OUTPUT CURRENT OUTPUT CURRENT
Figure 8. Figure 9.
(1) The electrical characteristic data has been developed from actual products tested at 25°C. This data is considered typical for the
converter. Applies to Figure 6, Figure 7, and Figure 8.
(2) The temperature derating curves represent the conditions at which internal components are at or below the manufacturer's maximum
operating temperatures. Derating limits apply to modules soldered directly to a 100-mm × 100-mm, double-sided PCB with 2-oz. copper.
Applies to Figure 9.
6 Submit Documentation Feedback Copyright © 2005–2013, Texas Instruments Incorporated
Product Folder Links :PTH08080W