
Datasheet


Table Of Contents
- FEATURES
- APPLICATIONS
- DESCRIPTION
- ABSOLUTE MAXIMUM RATINGS
- RECOMMENDED OPERATING CONDITIONS
- ELECTRICAL CHARACTERISTICS
- DEVICE INFORMATION
- TYPICAL PERFORMANCE CURVES OF INTERNAL FILTER
- TYPICAL PERFORMANCE CURVES
www.ti.com
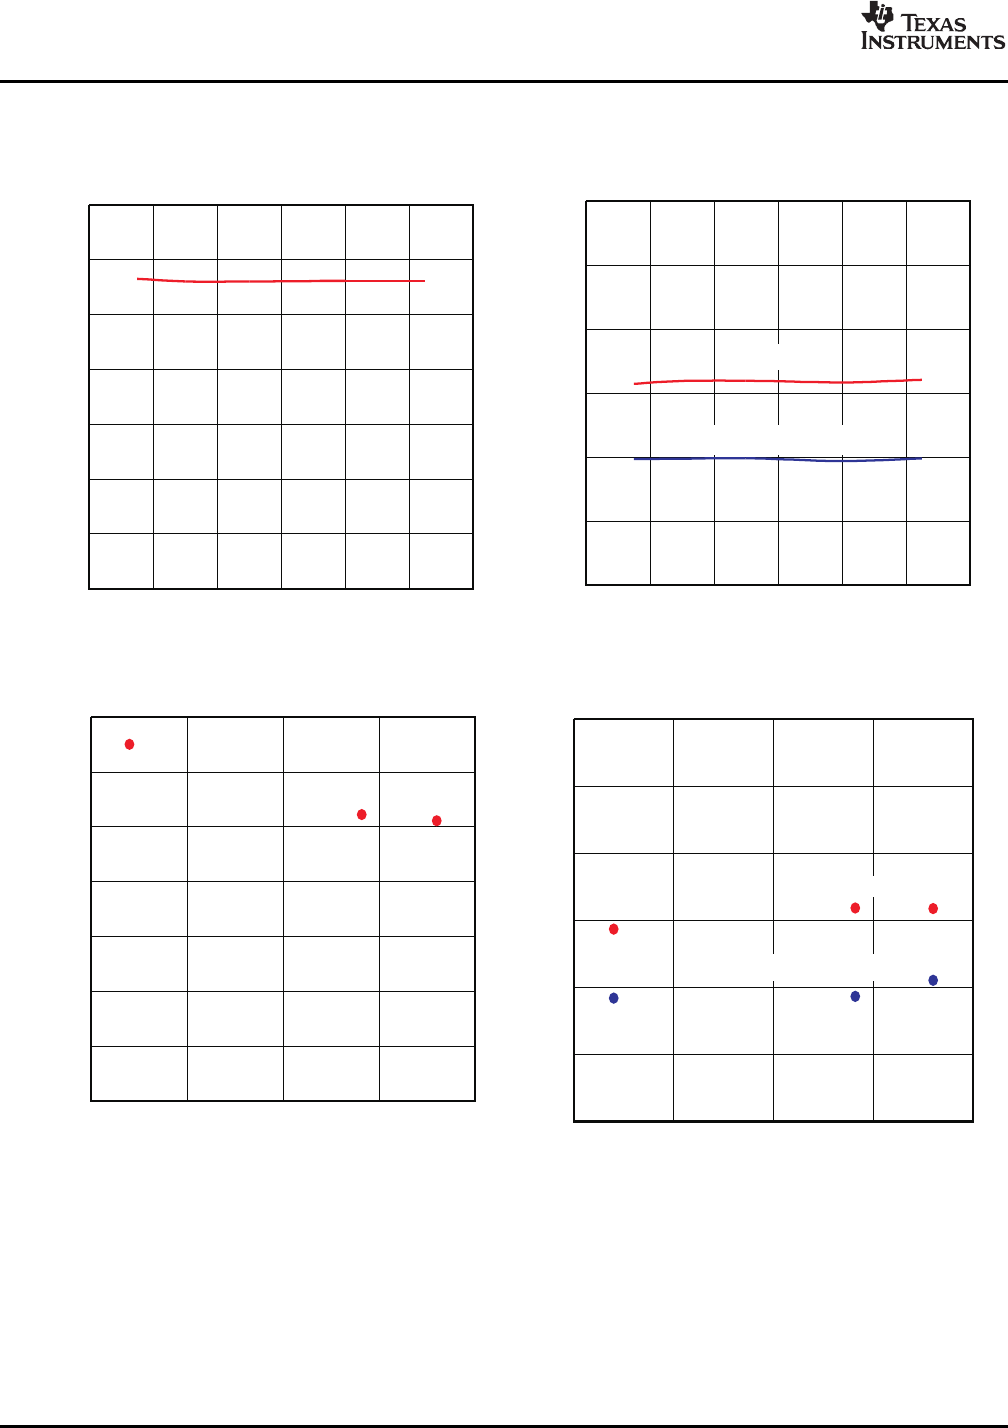
DYNAMICRANGEandSNRvsSUPPLY VOLTAGE
86
88
90
92
94
96
98
4.2 4.4 4.6 4.8 5 5.2 5.4
DYNAMICRANGE
SNR
V -SupplyVoltage-V
BUS
DynamicRangeandSNR-dB
THD+Nat0dBvsSUPPLY VOLTAGE
0.003
0.004
0.005
0.006
0.007
0.008
0.009
0.01
4.2 4.4 4.6 4.8 5 5.2 5.4
THD+N-TotalHarmonicDistortion+Noise-%
V -SupplyVoltage-V
BUS
THD+Nat0dBvsSAMPLINGFREQUENCY
0.003
0.004
0.005
0.006
0.007
0.008
0.009
0.01
30 35 40 45 50
THD+N-TotalHarmonicDistortion+Noise-%
f -SamplingFrequency-kHz
S
DYNAMICRANGEandSNRvsSAMPLINGFREQUENCY
86
88
90
92
94
96
98
30 35 40 45 50
DYNAMICRANGE
SNR
f -SamplingFrequency-kHz
S
DynamicRangeandSNR-dB
PCM2912
SLES216 – FEBRUARY 2008
TYPICAL PERFORMANCE CURVES (continued)
All specifications at T
A
= 25 ° C, V
BUS
= 5 V, f
S
= 44.1 kHz, f
IN
= 1 kHz, 16-bit data, unless otherwise noted.
Figure 24. Figure 25.
Figure 26. Figure 27.
16 Submit Documentation Feedback Copyright © 2008, Texas Instruments Incorporated
Product Folder Link(s): PCM2912