
Datasheet

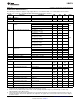


Table Of Contents
LMH6514
www.ti.com
SNOSB06A –JANUARY 2008–REVISED MARCH 2013
5V Electrical Characteristics
(1)
The following specifications apply for single supply with V
CC
= 5V, Maximum Gain , R
L
= 100Ω (200Ω external || 200Ω
internal), V
OUT
= 2 V
PP
, fin = 150 MHz. Boldface limits apply at temperature extremes.
Symbol Parameter Conditions Min Typ Max Units
(2) (3) (2)
Dynamic Performance
SSBW −3 dB Bandwidth Average of all Gain Settings 600 MHz
Noise and Distortion
Third Order Intermodulation f = 75 MHz, V
OUT
= 2 V
PP
−70
Products
f = 150 MHz, V
OUT
= 2 V
PP
−66
dBc
f = 250 MHz, V
OUT
= 2 V
PP
−60
f = 450 MHz, V
OUT
= 2 V
PP
−52
OIP3 Output Third Order Intercept Point f = 75 MHz, V
OUT
= 2 V
PP
, 35
Tone Spacing = 0.5 MHz
f = 150 MHz, V
OUT
= 2 V
PP
, 33
Tone Spacing = 2 MHz
f = 250 MHz, V
OUT
= 2 V
PP
, 31
Tone Spacing = 2 MHz
dBm
f = 75 MHz, R
L
= 200Ω, V
OUT
= 2 V
PP
39
Tone Spacing = 0.5 MHz
f = 150 MHz, R
L
= 200Ω, V
OUT
= 2 V
PP
, 37
Tone Spacing = 2 MHz
f = 250 MHz, R
L
= 200Ω, V
OUT
= 2 V
PP
, 34
Tone Spacing = 2 MHz
P1 dB Output Level for 1 dB Gain f = 75 MHz, R
L
= 200Ω 16.7
Compression
f = 250 MHz, R
L
= 200Ω 14.7
dBm
f = 75 MHz 14.5
f = 450 MHz 13.2
VNI Input Noise Voltage Maximum Gain, f = 40 MHz 1.8 nV/√Hz
VNO Output Noise Voltage Maximum Gain, f = 40 MHz 36 nV/√Hz
NF Noise Figure Maximum Gain 8.3 dB
Analog I/O
Differential Input Resistance 165 188 220
Ω
158 230
Input Common Mode Resistance 825 955 1120
Ω
785 1160
Differential Output Resistance Low Gain Option 186
Ω
High Gain Option 330 370 420
325 425
Internal Load Resistors Between Pins 13, 14 and Pins 15, 16 165 187 215
Ω
158 225
Input Signal Level (AC Coupled) Max Gain, V
O
= 2 V
PP
, R
L
= 1 kΩ 63 mV
PP
Maximum Differential Input Signal AC Coupled 5.6 V
PP
Input Common Mode Voltage Self Biased 1.3 1.4 1.5
V
1.1 1.7
Input Common Mode Voltage Driven Externally 0.9 to 2.0 V
Range
Minimum Input Voltage DC 0 V
Maximum Input Voltage DC 3.3 V
(1) Electrical Table values apply only for factory testing conditions at the temperature indicated. No specification of parametric performance
is indicated in the electrical tables under conditions different than those tested
(2) Limits are 100% production tested at 25°C. Limits over the operating temperature range are specified through correlation using
Statistical Quality Control (SQC) methods.
(3) Typical values represent the most likely parametric norm as determined at the time of characterization. Actual typical values may vary
over time and will also depend on the application and configuration. The typical values are not tested and are not ensured on shipped
production material.
Copyright © 2008–2013, Texas Instruments Incorporated Submit Documentation Feedback 3
Product Folder Links: LMH6514