
Datasheet


Performance Characteristics
www.ti.com
15 Performance Characteristics
Turn-on Waveforms
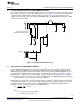
When applying power to the LM5027 evaluation board a certain sequence of events occurs. Soft-start
capacitor values and other components allow for a minimal output voltage for a short time until the
feedback loop can stabilize without overshoot. Figure 18 shows the output voltage during a typical start-up
with a 48V input and a load of 5A. There is no overshoot during startup.
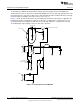
Output Ripple Waveforms
Figure 19 shows the transient response for a load of change from 2A to 25A. The lower trace shows
minimal output voltage droop and overshoot during the sudden change in output current shown by the
upper trace.
Figure 20 shows typical output ripple seen directly across the output capacitor, for an input voltage of 48V
and a load of 30A. This waveform is typical of most loads and input voltages.
Figure 21 and Figure 22 show the drain voltage of Q1 with a 25A load. Figure 21 represents an input
voltage of 38V and Figure 22 represents an input voltage of 78V.
Figure 23 shows the gate voltages of the synchronous rectifiers. The drive from the main power
transformer is delayed slightly at turn-on by a resistor interacting with the gate capacitance. This provides
improved switching transitions for optimum efficiency. The difference in drive voltage is inherent in the
topology and varies with line voltage
Conditions: Input Voltage = 48VDC Output Current = 2A to
Conditions: Input Voltage = 48VDC Output Current = 5A
25A Trace1: Output Voltage Volts/div = 0.2V Trace 2: Output
Trace 1: Output Voltage Volts/div = 1.0V Horizontal
Current Amps/Div = 5.0 A Horizontal Resolution = 1 ms/div
Resolution =1 ms/div
Figure 18. Turn-On Waveforms Figure 19. Output Ripple Waveforms
16
AN-1976 LM5027 Evaluation Board SNVA400B–August 2009–Revised May 2013
Submit Documentation Feedback
Copyright © 2009–2013, Texas Instruments Incorporated