
User manual


www.ti.com
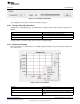
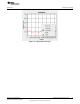
Data Streaming
Figure 3-5. Streaming Configuration
The sampling rate can only be set when streaming is stopped.
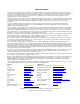
3.10.1 Average, Point, Min, Max Values
Average is the default display type. To toggle between sample point, min, and max values, right-click the
display.
Average The average of all the data points currently in the plot
Point The newest data point value currently in the plot
Min The minimum data point value currently in the plot
Max The maximum data point value currently in the plot
A larger number of samples would result in a larger averaging window.
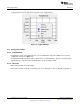
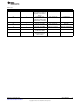
3.10.2 Zooming and Scaling
Plots are interactive. Zooming options are available by right-clicking the plot and selecting an option from
the context menu.
Figure 3-6. Plot Context Menu
Zoom to... Zooms to window
Autoscale Autoscales the data in the plot
Reset Resets the Zoom window to its default setting
Help Displays shortcut keys and mouse mappings for scaling and
zooming
11
SNAU150–September 2013 Inductive Sensing GUI User Guide
Submit Documentation Feedback
Copyright © 2013, Texas Instruments Incorporated