
- Texas AIP Consumer Audio User's Guide

www.ti.com
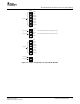
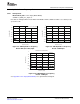
5.4.4 Amplitude Versus Frequency Performance
5.4.4.1 A/D Spectrum
0
20
40
60
80
100
120
140
-
-
-
-
-
-
-
Amplitude(dB)
AMPLITUDEvsFREQUENCY
0
5
10 15 20
Frequency(kHz)
BPZ(ZeroData)Input
0
20
40
60
80
100
120
140
-
-
-
-
-
-
-
Amplitude(dB)
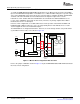
AMPLITUDEvsFREQUENCY
0
5
10 15 20
Frequency(kHz)
-60dBInput
0
20
40
60
80
100
120
140
-
-
-
-
-
-
-
Amplitude(dB)
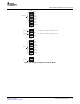
AMPLITUDEvsFREQUENCY
0
5
10 15 20
Frequency(kHz)
-1dBInput
Measurements for Dynamic Characteristics
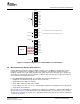
Measurement path: 17.Line Input (AIN3L/AIN3R)
csv file: 17_ADC_Line_Input.csv
Note that an unweighted filter and an AES17 bandwidth of 22Hz to 20kHz should be set to obtain precise
spectrum results.
Figure 5-8. A/D Amplitude vs Frequency Figure 5-9. A/D Amplitude vs Frequency
Result: BPZ (Zero Data) Input Result: –60dB Input
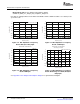
Figure 5-10. A/D Amplitude vs Frequency
Result: –1dB Input
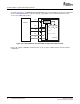
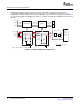
See Appendix A : Line Input (AIN3L/AIN3R) for a signal flow block diagram.
SBAU127 – July 2007 Evaluation and Measurements 59
Submit Documentation Feedback