
User Manual

7 Analysis & reports
17
7 Analysis & reports
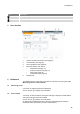
7.1 Data analysis
Displaying and analyzing readings and alarms
The display can be filtered according to the following characteristics:
• By measuring point group/measuring point: click on the checkbox in front of
the measuring point group/measuring point.
• By date/time: click on the start date/end date and select the start date/start
time and end date/end time.
• By time range: click on the required time range, for example Last hour.
Readings can be displayed in a table or as a graphic.
• Click on the Table or Graphic button to select the required view.
• In the Graphic data view, other analysis functions are available. See Online
Help.
Alarms can be presented as a table.
• Click on the Alarms button to display the alarms.
• Click on the icon to display more information.
Exporting readings and alarms (manually create a report)
1. Filter the display so that the measuring points and time periods that you
want to appear in the report are displayed.
2. Click on the Export button and select the required output format (PDF or
CSV).
3. Enter the data required to create the report and click on the Generate and
download button.
Creating an automatic report
Automatic reports are regularly generated automatically by the system, according
to the settings specified by the user.
1. Click on the Create an automatic report button.
2. Enter the data required to create the automatic report and click on the
Create an automatic report button.
See also Automatic reports, page 17.
7.2 Automatic reports
Automatic reports are regularly generated automatically by the system (Generated
reports), according to the settings specified by the user (Report settings).
Creating an automatic report
1. Click on the Create an automatic report button.
2. Enter the data required for creating the automatic report.
The following settings can be defined and edited:
• Name of the report: designation of the automatic report.
• Measuring points for the report: measuring points that are to be covered
in the report. Click on the checkbox in front of the channel designation.
• How often is the report to be created?
: interval at which the reports are to
be generated. Select a report cycle from the drop-down menu.
• File format
: file format in which the reports are to be generated. Select a file
format from the drop-down menu.
• Data views: data views in which the data in the reports is to be displayed.
Click on the checkbox in front of the data view designation.