
Data Sheet


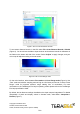

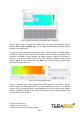
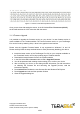

Figure 9. Stream raw distance and ambient values in real-time
You can also choose to visualize the ambient values in an 8x8 pixel grayscale map by
selecting File > View > Ambient map. This can be useful in detecting other near-infrared
sources in your environment.
You can also export raw distance and ambient data in a text-format file, by selecting “Save”
on the main screen of the GUI. Next, you’ll be asked to save the text file in a location of your
preference. Afterwards a dialog window will appear offering to specify exact amount of
frames to be exported. Please note that one frame equals 64 distance values and 64
ambient values. Once this is specified, click “Save” and your text file will be exported. See
Figure 10 for visual instructions.
Figure 10. Export raw distance data
Figure 11 illustrates a text file of exported data with 3 frames. The first value in the row
always indicates the sequential number of the frame, followed by a header; 17 for distance
readings and 19 for ambient values. In the example above, the first row shows 64 distance
values in millimeters and the second row shows 64 values on near-infrared ambient; both
rows are part of frame number 1.
Copyright © Terabee 2018
Terabee, 90 Rue Henri Fabre
01630, St Genis-Pouilly, France (next to CERN)
9/22