
Data Sheet


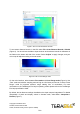

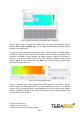
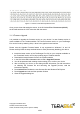

Figure 7. Interpolate vs discrete mode
The GUI also offers the option to display the distance data in a 3 dimensional map
representation. Select File > View > 3D Plot, and a new window will now open with the 64
pixels represented in a 3D model. Choose to demonstrate the 3D model in a Plane or Mesh
view (Figure 8), both options can be selected at the bottom of the main GUI screen.
Figure 8. View data in a 3D plot: Plain vs Mesh view
Select File > View > Pixel Data and stream a matrix of 8x8 distance values in millimeters in
real-time. The “Pixel Data” option also streams 64 values of ambient level in real-time, which
is proportional to the target irradiance centered around 940nm. See Figure 9 for visual
instructions.
Copyright © Terabee 2018
Terabee, 90 Rue Henri Fabre
01630, St Genis-Pouilly, France (next to CERN)
8/22