
Data Sheet

Copyright © Terabee 2018
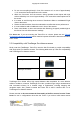
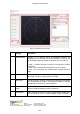
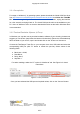
Figure 2. Graphical user interface
#
Display
Description
1
Measurement
Provides 4 or 8 distance values in millimeters. Sensors are
numbered as per the Hub Evo board. Example: TR Evo 4 will
stream distance data connected to connector Nr 4 on Hub Evo.
In case “-1” value is received, no sensor is connected or not able
to measure.
In case “+Inf” is received, the measurement is out of range.
In case “-Inf” is received, the measurement is below minimum
range.
2
Zoom
Modify scale of the main chart (#3) by dragging the cursor to the
left or right. The zoom range is [2.00m ; 60.0m].
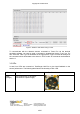
3
Main chart
Provides real-time preview of distance measurements streamed
from connected Evo sensors. The distance reading is visually
represented on the chart by a small segment.
4
Measurement
mode
Switch between, Simultaneous, Sequential and Tower mode
(learn more about operating modes in section 5).
5
Update rate
Select between six options of sensor measurement update rates
from a drop-down menu. Choose between Fixed (F) 50Hz, F
Terabee Website:
90 Rue Henri Fabre Technical support:
01630, Saint-Genis-Pouilly Commercial:
www.teraranger.com
support@teraranger.com
teraranger@terabee.com
7/27